Blog
GitHub blog posts
Auto-pulled from repos whose README front-matter includes type: blog.
No GitHub repos tagged type: blog found.
Posts from across my repos
Auto-discovered: any of my Pages-enabled repos that contains a file matching blog*.qmd at its root (e.g. blog.qmd, blog1.qmd, blog2.qmd) is scanned on every render, and each post appears below.
The short version
In any of your Pages-enabled repos, create a file at the repo root named blog.qmd, blog1.qmd, blog2.qmd, … with a YAML front-matter block like:
---
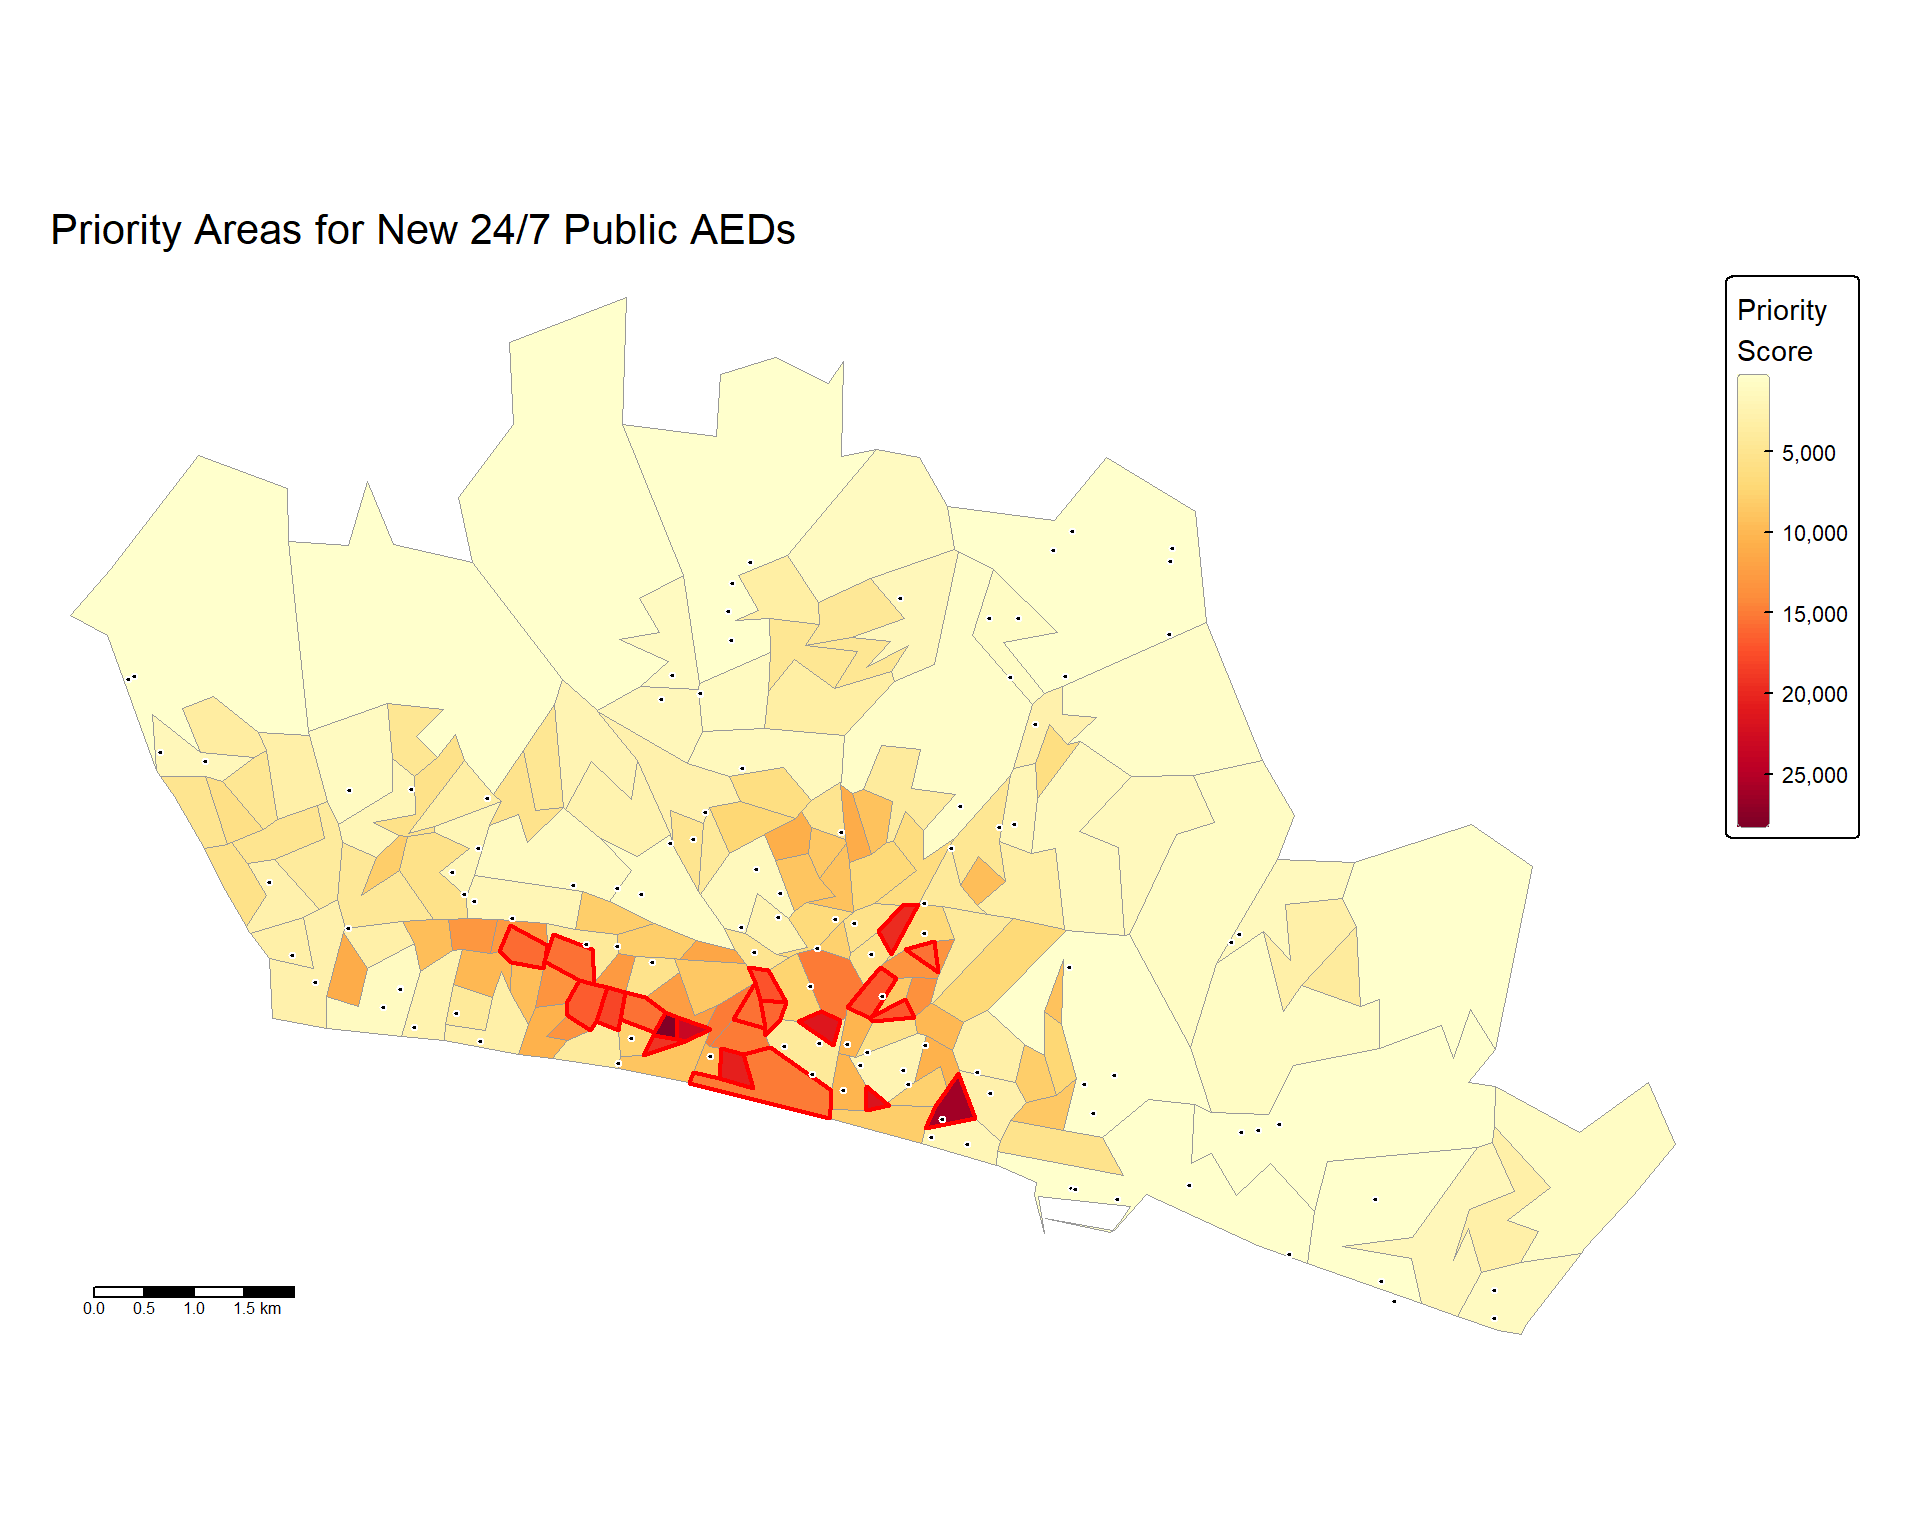
title: "A short writeup on mapping Brighton's AEDs"
description: "What we found when we joined OS AED data to population vulnerability."
date: 2026-05-20
image: thumb.png # optional; relative path inside the repo or a full URL
# site: blog1.html # optional override of the rendered URL
# draft: true # uncomment to hide while drafting
---
Body of the post goes here…If the repo has the render-blogs.yml workflow installed (see below), that’s it — write directly in github.com’s web editor, commit, and the post auto-renders and appears here on the next site rebuild. Otherwise you’ll need to render locally (quarto render) and commit both the .qmd and the .html.
Auto-render workflow (recommended)
The repo defibrillator-analysis is set up as the reference example. The workflow file lives at .github/workflows/render-blogs.yml in that repo. A copy of the workflow lives in templates/render-blogs.yml in this site repo as a drop-in template.
To enable auto-render in a new project repo:
- Copy
templates/render-blogs.ymlfromad_live_websiteinto the target repo at.github/workflows/render-blogs.yml. - Confirm Pages is enabled on
main/docsand that_quarto.ymlhasoutput-dir: docs. - Make sure
.gitignoredoesn’t excludedocs/. - Push the workflow file. From then on, any push that touches a
blog*.qmdtriggers a render → docs/ → Pages → live URL.
The workflow only renders single blog*.qmd files, so it won’t try to re-execute the project’s bigger qmd files (which need R + data). If you want R code chunks inside a blog post, uncomment the setup-r steps in the workflow template and list the packages you need.
How adamdennett.co.uk picks it up
Every time this site renders (push, manual trigger, or the daily 05:30 UTC cron), it walks every Pages-enabled owner-repo via the GitHub Trees API, finds any blog*.qmd at the root, parses the front-matter, and links a card here to https://adamdennett.github.io/{repo}/{filename}.html.